-
 [email protected]
-
 +86-17712471297
[email protected]
+86-17712471297

Content
In the rapidly evolving solar energy sector, the performance and reliability of photovoltaic (PV) systems are paramount. At the heart of maintaining and verifying this performance lies a sophisticated diagnostic tool: the IV curve tester. This device, which measures the current-voltage (IV) characteristics of solar panels and arrays, has become indispensable for installers, technicians, and engineers. It provides a comprehensive snapshot of a solar panel's health, much like an electrocardiogram for the human heart. By generating a characteristic curve, it reveals critical parameters such as short-circuit current (Isc), open-circuit voltage (Voc), and maximum power point (Pmax), allowing for the precise identification of issues that would otherwise remain hidden. The evolution of this technology from bulky, complex laboratory equipment to portable, user-friendly field devices has democratized high-level diagnostics, enabling a proactive approach to solar asset management. This article delves deep into how modern IV curve testers are not just supporting but actively driving higher reliability in solar installations, ensuring that systems operate at their peak potential throughout their decades-long lifespan.
The contemporary IV curve tester is a marvel of engineering, designed to bring laboratory-grade accuracy to the field. Understanding its components and capabilities is the first step toward appreciating its impact on solar reliability.
A modern IV curve tester is more than just a meter; it is an integrated diagnostic system. Its core components work in harmony to capture, process, and display critical performance data.
The shift from stationary lab equipment to portable field devices has been a game-changer for the solar industry. The primary advantage of a portable iv curve tracer for field technicians is its ability to deliver immediate, actionable intelligence at the point of need. Technicians are no longer required to take notes, manually input data, or make assumptions based on limited information. They can perform a series of tests—on individual modules, strings, and entire arrays—directly on the rooftop or at the ground-mounted site. This portability facilitates a comprehensive quality assurance process post-installation, ensuring that every connection is sound and every module is performing as expected before the system is energized. It also drastically reduces the time required for periodic maintenance checks and fault diagnosis, as the root cause of an underperforming system can be pinpointed within minutes rather than hours or days. The ergonomic design, ruggedized casing, and long battery life of these tracers are all engineered to withstand the harsh conditions typical of solar installation sites, making them a reliable partner for the field technician.
Capturing an IV curve is only half the battle; the true value is unlocked in the analysis. Modern testers are paired with sophisticated iv curve data analysis software features that transform raw voltage and current data into a powerful diagnostic narrative. This software typically operates on a computer or tablet, providing a larger canvas for deep analysis and reporting.
The software automatically compares the measured field curves against the theoretical or nameplate curve provided by the module manufacturer. It calculates key performance metrics like Fill Factor (FF) and performance ratio (PR), which are excellent indicators of overall health. Advanced software can batch-process hundreds of curves from a site survey, automatically flagging any strings or modules that deviate from expected parameters by a user-defined threshold. This allows for the rapid identification of outliers without the need for manual inspection of every single curve.
Furthermore, these platforms often include powerful visualization tools. Technicians can overlay multiple curves from different strings to identify systematic issues or track the performance of a specific module over time to monitor degradation rates. The ability to generate professional, detailed reports is another critical feature. These reports, which can include graphs, tables, and annotated findings, are essential for communicating issues to clients, justifying warranty claims with manufacturers, and maintaining a historical record for the asset's lifecycle management. The synergy between the portable hardware and the intelligent software creates a closed-loop diagnostic ecosystem that elevates the entire maintenance paradigm from reactive to predictive.
The ultimate goal of using an IV curve tester is to move beyond simple verification and into the realm of proactive system management. This involves identifying subtle problems early and understanding long-term performance trends.
Solar panels naturally degrade over time, but the rate and nature of this degradation are critical to projecting the long-term financial returns of a system. identifying solar panel degradation with iv testing is one of the most precise methods available. Unlike periodic energy output measurements, which can be influenced by daily weather fluctuations, an IV curve provides a normalized, instantaneous health check. Different types of degradation leave distinct fingerprints on the IV curve. For instance, Light-Induced Degradation (LID) typically manifests as a uniform reduction in the short-circuit current (Isc) and maximum power (Pmax). Potential-Induced Degradation (PID), on the other hand, often causes a significant drop in the open-circuit voltage (Voc) and a "shifting" of the curve. By analyzing the specific shape and parameters of the curve, technicians can not only confirm that degradation is occurring but can also hypothesize about its root cause. This allows for targeted interventions, such as checking grounding schemes for PID or verifying manufacturing batches for LID, thereby protecting the system's energy yield and the owner's investment.
When a solar system underperforms, the cause is not always obvious. troubleshooting common pv system faults with iv curves provides a systematic and highly effective methodology for diagnosis. The IV curve acts as a unique signature for different fault conditions.
The table below provides a clear comparison of how different faults manifest on an IV curve:
| Fault Type | IV Curve Signature | Key Parameter Changes |
|---|---|---|
| Partial Shading | Distinct "steps" or multiple humps in the curve | Multiple peaks in power (Pmax); reduced Isc |
| Open Circuit | No curve generated (zero current and voltage) | Voc = 0; Isc = 0 |
| High Series Resistance | Curve is "squished" to the left, lower Fill Factor | Significant drop in Pmax and Vmp; Isc may be normal |
| Potential-Induced Degradation (PID) | Entire curve shifted down and to the left | Major reduction in Voc and Pmax |
The requirements for testing a residential rooftop system are vastly different from those of a utility-scale solar farm. When comparing iv curve testers for large scale solar farms, several critical factors come into play that go beyond basic functionality. The primary consideration is efficiency and speed. A tester used on a 100MW farm must be able to capture a high-fidelity IV curve in a matter of seconds to minimize testing time across thousands of strings. Its battery life must be sufficient for a full day of intensive use without requiring a recharge. Data management becomes paramount. The device must have massive internal storage and ultra-fast data transfer capabilities to handle the terabytes of data generated during commissioning or a full-site inspection.
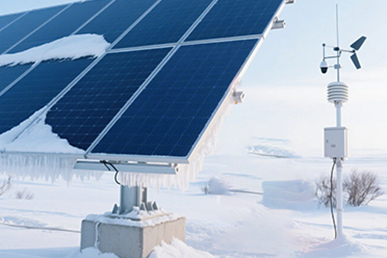
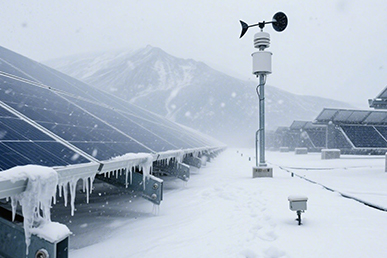
Durability and environmental sealing are also non-negotiable. These testers will be used in extreme conditions, from desert heat to freezing temperatures, and must be built to IP65 or higher standards to keep out dust and moisture. Furthermore, the accompanying analysis software must be capable of managing data on a massive scale, providing fleet-level overviews while still allowing drill-down capabilities to individual string-level performance. The ability to integrate with broader Asset Management and SCADA systems is a significant advantage, allowing IV curve data to become part of the site's central nervous system. In this context, the choice of a tester is a strategic decision that impacts the operational efficiency and long-term profitability of the entire solar asset.
The integration of modern IV curve testers into the solar lifecycle—from installation and commissioning to ongoing operations and maintenance—represents a fundamental shift towards a data-driven reliability model. These tools empower professionals to move from guessing to knowing, from reacting to predicting. The ability to capture a precise, normalized performance signature of a solar array at any point in time provides an unparalleled foundation for quality assurance, warranty validation, and performance optimization. As the technology continues to advance, with trends pointing towards greater integration with drones for autonomous testing and the use of artificial intelligence for automated fault classification, the role of the IV curve will only become more central. By embracing these advanced diagnostic capabilities, the solar industry can ensure that its installations are not only initially efficient but also consistently reliable, durable, and profitable for decades to come, solidifying solar energy's role as a cornerstone of the global clean energy transition.


We value your suggestions and questions. If you have any questions about our products and services, please contact us. We will treat you responsibly and reply to your information as soon as possible.
 Building 14, Chuangjin Industrial Park, Zhitang Town, Changshu City, Suzhou City, Jiangsu, China
 +86-17712471297

 EN
EN