-
 [email protected]
-
 +86-17712471297
[email protected]
+86-17712471297

Content
Determining whether a solar panel system is performing as expected requires checking several indicators in sequence — from the simplest visual and monitoring checks to more detailed electrical measurements. Most issues that reduce output are detectable before they cause significant energy loss if checked systematically.
The inverter is the first place to check. In a functioning system, the inverter display or indicator light shows normal operation — typically a green light or a live display showing current power output in watts or kilowatts. A red or amber warning light, an error code on the display, or a completely blank display on a bright sunny day indicates a fault condition. Common inverter fault codes point to grid connection issues, ground faults in the array, or isolation failures that the inverter's protection circuitry has detected and shut down the system to prevent damage or safety hazards. Inverter error codes are manufacturer-specific; the manual or the manufacturer's support line will identify what each code means for your specific model.
Most inverters sold in the past ten years include WiFi monitoring that uploads production data to a cloud portal or smartphone app. The most reliable way to assess whether panels are working normally is to compare today's generation against the same day in the previous week and the previous year, adjusted for weather. A system generating 30–40% less than historical data for the same calendar period and similar weather conditions is underperforming and warrants further investigation. Many monitoring platforms flag underperformance automatically and alert the system owner.
If monitoring shows zero generation during daylight hours when the inverter appears to be powered, the issue is almost always either a tripped AC circuit breaker between the inverter and the utility connection, a blown DC fuse on one or more string circuits, or a failed inverter. If monitoring shows partial generation — some strings producing but not others — the issue is most likely in the underperforming string specifically: a faulty panel, a loose DC connector, or shading that wasn't present in prior years due to tree growth.
From ground level, or safely from a ladder when accessible, examine the panels for visible signs of damage or conditions that reduce output:
A quick sanity check on system performance: multiply the total installed panel capacity in kilowatts by the peak sun hours for your location and date, then compare to the inverter's reported daily generation. For example, a 6 kW system in a location receiving 4.5 peak sun hours should generate approximately 27 kWh on a clear day (6 kW × 4.5 hours), accounting for typical system losses of 15–20% gives an expected output of 22–23 kWh. Consistent generation of less than 75% of the calculated expected value on clear days indicates a system fault worth investigating further.
A digital multimeter is the most accessible tool for diagnosing solar panel electrical problems at the panel level. Testing panels with a multimeter can identify whether a panel is producing voltage and current within its rated specifications, locate open-circuit or short-circuit faults, and verify that DC wiring and connections are intact.
Safety first: solar panels generate electricity whenever they are exposed to light — they cannot be "switched off" the way mains electrical circuits can be. Even on an overcast day, a standard residential panel produces sufficient voltage (typically 30–40V open circuit) to deliver a dangerous shock. Always use a multimeter with a voltage rating above the maximum system voltage; use insulated tools and gloves; and never work on DC wiring during wet conditions.
A standard digital multimeter capable of measuring DC voltage up to at least 600V and DC current up to 10–20A is sufficient for testing most residential panels. For current measurement, many standard multimeters have a 10A maximum DC current input — adequate for testing individual panels (which typically produce 8–12A at full sun) but check the panel's Isc (short-circuit current) specification before connecting the current measurement probes.
Open-circuit voltage is the voltage the panel produces when no load or circuit is connected. To measure it: disconnect the panel from the string circuit (at the MC4 connector level if accessible, or at the string combiner box if present); set the multimeter to DC Voltage; connect the red probe to the positive terminal and black probe to the negative terminal of the panel. The reading should be close to the panel's rated Voc specification — typically 35–45V for a standard 60-cell residential panel — adjusted for temperature. Voc increases as panel temperature decreases; on a cold clear day, Voc may be 10–15% above the STC-rated value, while on a hot summer day it will be 5–10% below. A reading significantly below expected Voc (more than 15–20% below the temperature-adjusted value) indicates a cell fault, bypass diode failure, or wiring problem within the panel.
Short-circuit current is measured by connecting the multimeter in ammeter mode directly across the panel terminals — this places the multimeter in series with a near-zero resistance path, creating the short-circuit condition. Set the multimeter to DC Amperes (use the 10A or 20A input terminal); connect probes directly to the panel's positive and negative leads. The reading reflects available light intensity as much as panel condition — Isc is directly proportional to irradiance, so a reading of 7A on a partly cloudy day is not necessarily a fault; the same panel might produce 9.5A under full sun. For a meaningful comparison, test the suspect panel alongside a known-good panel of the same model under identical lighting conditions and compare the two Isc readings. A current reading more than 10–15% below a comparator panel in the same irradiance conditions indicates a problem in the suspect panel.
A ground fault — an unintended electrical path between the DC circuit and the grounded metal frame of the panel or racking — is a safety hazard and a common cause of inverter shutdown with a ground fault error code. To test: set the multimeter to AC/DC voltage; measure between the positive terminal and ground (the panel frame); then measure between the negative terminal and ground. On a healthy system, both readings should be zero or very close to zero. A reading above a few volts on either test indicates a ground fault that must be located and repaired before the system is returned to operation.
| Measurement Result | Likely Cause | Next Step |
|---|---|---|
| Voc reads 0V in full sun | Open circuit — broken cell, failed bypass diode, severed wire | Replace panel or inspect junction box |
| Voc 15–20% below rated | Cell degradation, hotspot, or partial shading inside laminate | EL imaging or thermal imaging for confirmation |
| Isc significantly lower than a comparator panel | Cell cracks, delamination, soiling, or bypass diode fault | Clean panel surface first; if issue persists, inspect panel |
| Voltage between terminal and frame > 2V | Ground fault in panel or wiring | Isolate system; locate and repair fault before re-energizing |
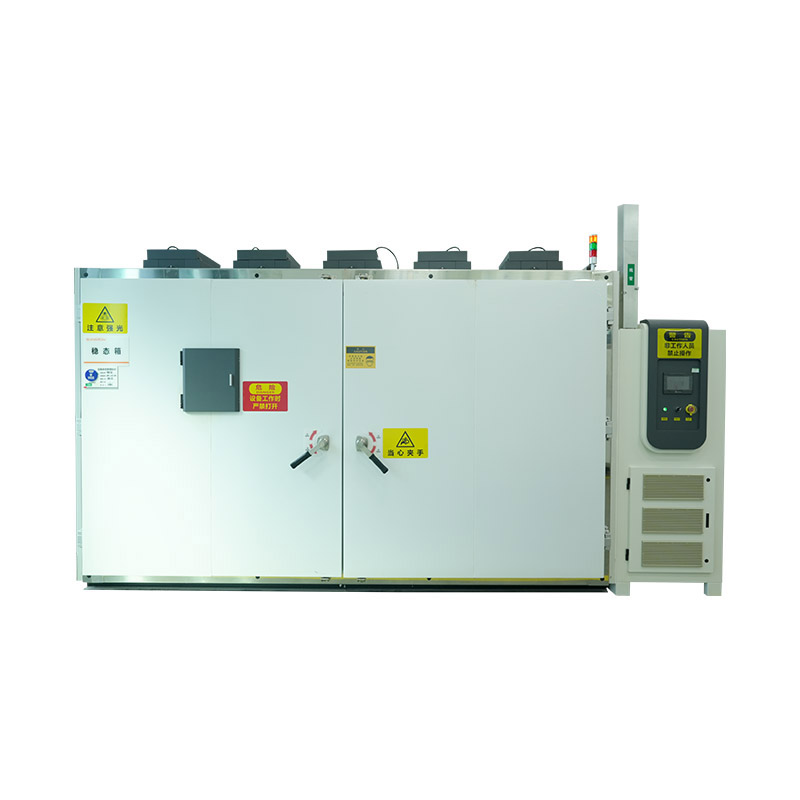
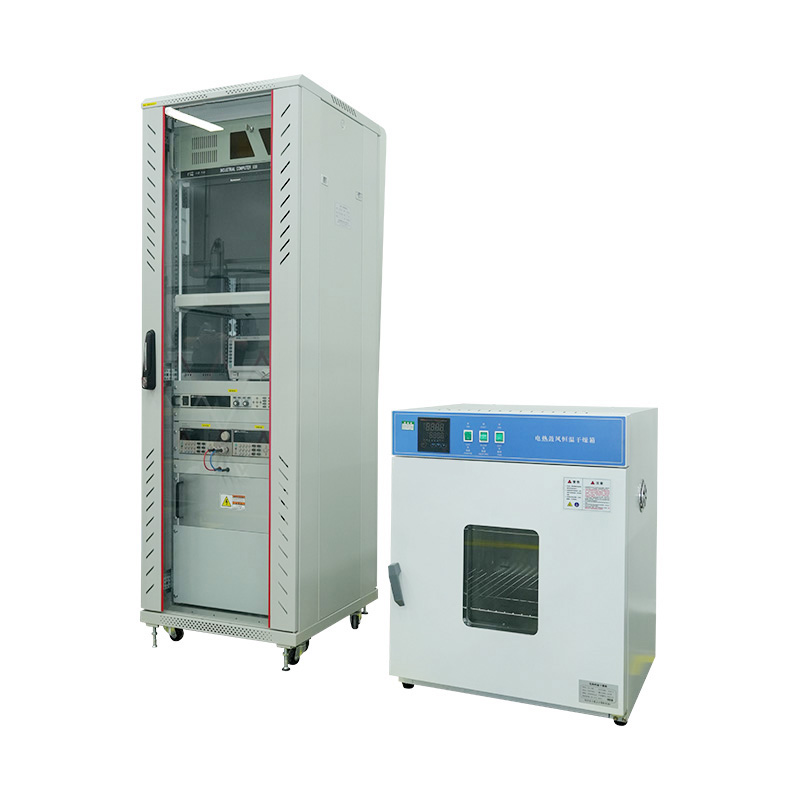
While field testing with a multimeter identifies gross faults, the definitive performance qualification and reliability testing of photovoltaic modules is conducted in specialized PV module testing chambers and test stations that simulate controlled conditions defined by international standards. These facilities are used by module manufacturers for quality assurance, by certification bodies for type approval, and by research institutions for degradation studies and new technology qualification.
The fundamental PV module performance measurement is the I-V curve (current-voltage curve) taken at Standard Test Conditions: 1,000 W/m² irradiance, AM1.5 spectrum, and 25 °C cell temperature. A solar simulator replicates these conditions using a flash lamp or continuous xenon lamp source with an AM1.5G filter, calibrated to the spectral requirements of IEC 60904-9. Class A simulators — required for IEC 61215 type approval testing — must meet specifications for spatial uniformity of irradiance (±2%), spectral match (0.75–1.25 in each wavelength interval), and temporal stability during the measurement flash.
The I-V curve measurement yields the module's key electrical parameters: Pmax (maximum power), Voc, Isc, Vmpp (voltage at maximum power point), Impp (current at maximum power point), and fill factor. These values, measured at STC, are what appear on the module's nameplate and are the baseline against which field performance and degradation are measured over the module's service life.
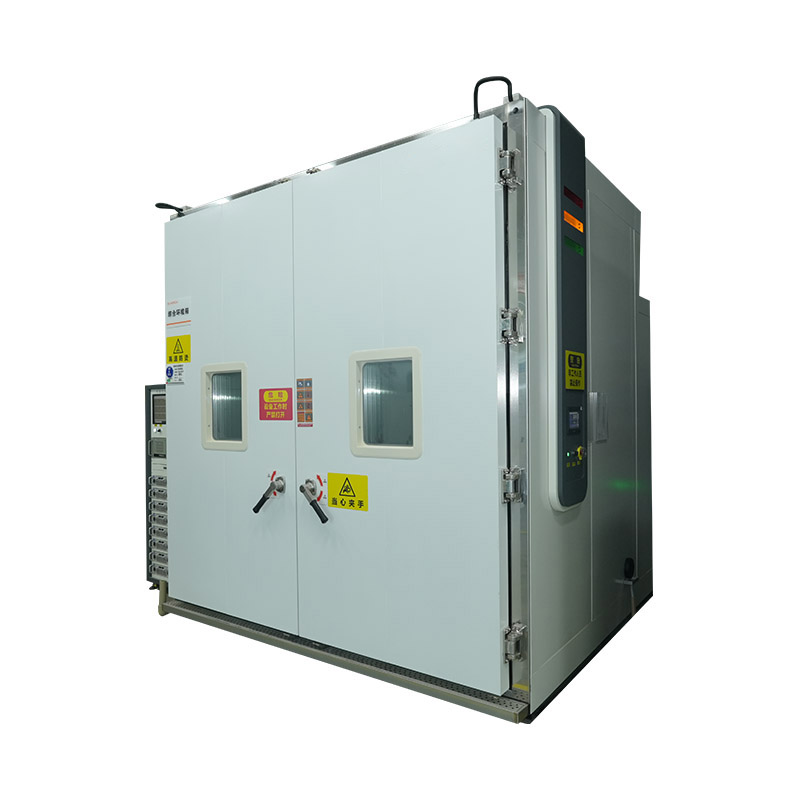
IEC 61215 (crystalline silicon modules) and IEC 61646 (thin-film modules) define the standard qualification test sequences that PV modules must pass before certification. Two of the most demanding tests are performed in environmental test chambers:
Thermal cycling (TC200 per IEC 61215) subjects modules to 200 cycles between –40 °C and +85 °C, with controlled ramp rates and hold times at each temperature extreme. The test verifies that solder joints, cell interconnections, frame bonding, and encapsulant materials can withstand the mechanical stress of repeated thermal expansion and contraction over a simulated 25-year service life. Failures in thermal cycling typically manifest as increased series resistance, cracked interconnects, or delamination. The test chamber for this application must maintain temperature uniformity across the module area of ±2 °C and achieve the full temperature range with controlled transition rates.
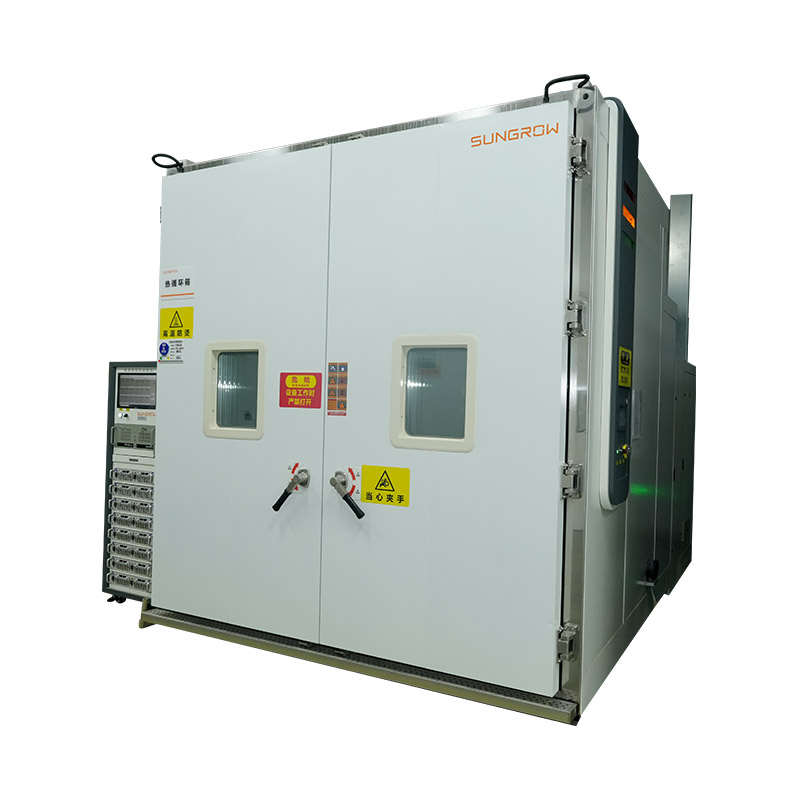
Damp heat testing (DH1000 per IEC 61215) holds modules at 85 °C and 85% relative humidity for 1,000 hours — the industry's standard accelerated moisture ingress test. This conditions simulates years of exposure to hot, humid environments and reveals weaknesses in junction box sealing, edge seal adhesion, and encapsulant moisture resistance. Environmental test chambers for damp heat testing must maintain temperature and humidity uniformity within the module array with precision tolerances; temperature non-uniformity creates differential moisture uptake rates that produce misleading results.
UV pre-conditioning chambers expose modules to a defined UV dose (15 kWh/m² total UV irradiance per IEC 61215) to pre-condition the encapsulant and surface materials before subsequent mechanical tests. UV exposure causes the EVA encapsulant to undergo initial crosslinking and potential yellowing; modules that would fail after UV exposure combined with thermal cycling are detected at the qualification stage rather than in the field. The UV sources in these chambers are filtered xenon or UV fluorescent lamps with spectra matched to the test standard's requirements, and irradiance uniformity across the module area must be characterized before the test begins.
Light soaking chambers are specifically required for thin-film module qualification. Amorphous silicon and certain other thin-film technologies exhibit the Staebler-Wronski effect — an initial light-induced degradation of conversion efficiency that stabilizes after a defined light exposure period. IEC 61646 requires light soaking at 1,000 W/m² for 600–1,000 hours before electrical characterization to ensure that reported efficiency values reflect the stabilized, real-world performance state rather than the initial higher efficiency measured before light-induced degradation has occurred.
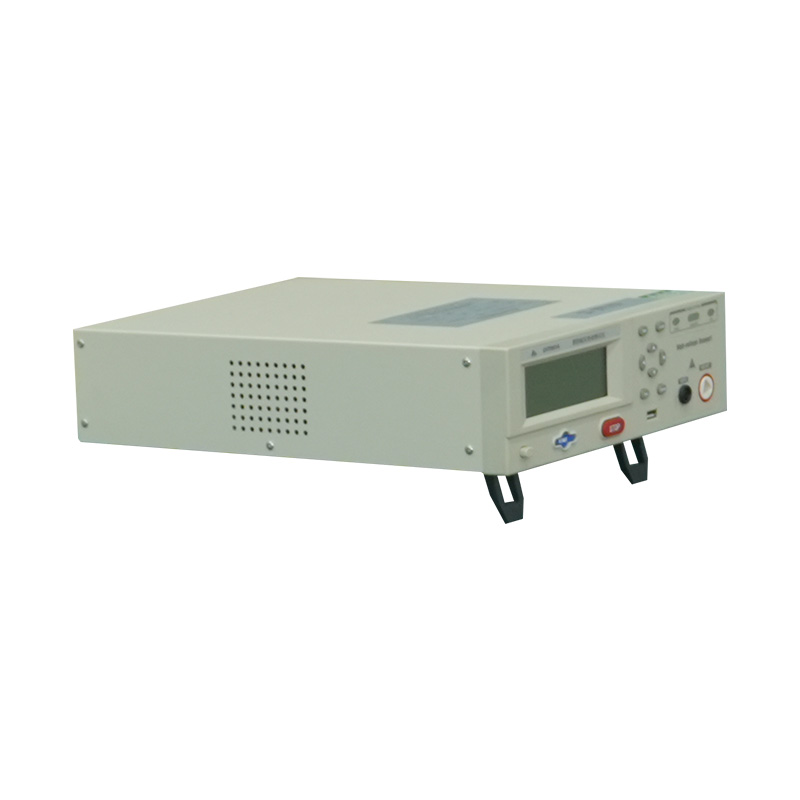
Electroluminescence (EL) imaging is a non-destructive inspection technique that reveals cell defects — microcracks, inactive cell areas, shunts, and interconnect failures — that are invisible to the naked eye and undetectable by standard electrical measurement alone. The module is forward-biased by an external DC source (driven like an LED rather than a solar cell), causing the photovoltaic junctions to emit near-infrared light. A sensitive silicon CCD or InGaAs camera captures the emission pattern; defective areas that do not emit appear dark in the image. EL imaging systems range from portable field units for on-roof inspection to integrated laboratory systems built into full characterization lines at module factories and certification labs.
In the context of PV module testing chambers at manufacturing facilities, EL imaging is used for 100% in-line quality control on module production lines, identifying process defects before modules ship. At certification and research laboratories, EL imaging is performed before and after each stress test sequence in the qualification protocol, allowing precise characterization of how each test has affected cell and interconnect integrity — data that guides both module design improvement and warranty claim evaluation.


We value your suggestions and questions. If you have any questions about our products and services, please contact us. We will treat you responsibly and reply to your information as soon as possible.
 Building 14, Chuangjin Industrial Park, Zhitang Town, Changshu City, Suzhou City, Jiangsu, China
 +86-17712471297

 EN
EN